
Calgary vs Canmore Real Estate: Two Alberta Markets Moving in Opposite Directions (2025)
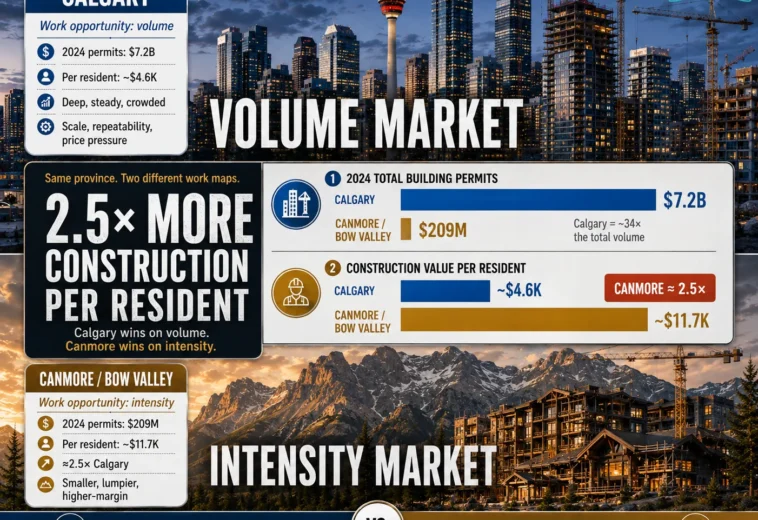
Look at Calgary vs Canmore real estate side by side and you would assume you are reading one story: two Alberta markets, one hour apart, both riding the same provincial economy. You are not. In 2025 they moved in opposite directions — Calgary’s benchmark price fell while Canmore’s detached homes climbed almost 10%. The numbers below show why these are not the same market, and why anyone building or investing in Alberta needs to know which one they are actually in before they run a single spreadsheet.
The headline: same province, opposite directions
Where people go and where capital goes are two different maps. Calgary is a market driven by residents who need somewhere to live. Canmore, in the Bow Valley, is increasingly a market driven by capital that wants somewhere to store value. That single distinction explains almost every data point that follows.

Construction tells the first story
In absolute terms, there is no contest. The City of Calgary issued roughly $7.2 billion in building permits in 2024, a record year. The Town of Canmore issued about $209 million — and around $170 million in 2025. Calgary pushes out roughly 34 times the construction value.
But divide by population and it flips. Per resident, Calgary permitted about $4,600 of construction; Canmore permitted roughly $11,700 — close to 2.5x the intensity of Alberta’s largest city. A town of about 16,000–17,000 people runs construction value per head that a metro of 1.6 million cannot match. One caveat, stated plainly: Canmore’s figure is lumpy — a single large project can swing a year. In a small market, one capital-funded build reshapes the whole picture. In Calgary, no single project moves the needle.
Prices are splitting in 2025 — and that is the real Calgary vs Canmore real estate signal
This is where the divergence stops being theory. At the end of 2025:
- Calgary — residential benchmark price of $554,700, down 4.7% year over year as supply caught up with cooling demand.
- Canmore — average sale price around $1.2 million, with detached homes near $1.8 million, up about 9.5% on the year.
Same province, same twelve months: one market down almost 5%, the other up almost 10%. Calgary’s price is set by residents, jobs and mortgage rates. Canmore’s is set by intergenerational wealth and out-of-province capital that does not blink at cost.
Who actually owns — and who just visits
The ownership and occupancy data (2021 Census, the most recent full count) sharpens the picture further.
| Metric | Calgary (City) | Canmore (Town) |
|---|---|---|
| Homeownership rate | 68.8% | 66.2% |
| Homes not occupied by a resident (“empty”) | 5.4% | 25.8% |
| Benchmark / average price (Dec 2025) | $554,700 | ~$1.2M (detached ~$1.8M) |
| Building permits (2024) | $7.2B | $209M |
The standout number: in Canmore, roughly one home in four (25.8%) is not occupied by a permanent resident — about five times Calgary’s rate. The Town itself estimates that around 26% of properties are second homes in 2025, and has introduced a Livability Tax (an extra levy of roughly 0.4% of property value, budgeted at $10.3 million for 2025–26 to fund 2,000 non-market homes). In the store-of-value market, the capital owns the asset and the local workforce rents. Calgary’s rental vacancy sat near 5.0% in 2025; Canmore is too small and too tight for CMHC to even report one.
The mechanism: housing versus store of value
Strip it down and the two markets answer two different questions:
- Calgary is housing. Price tracks residents, jobs and supply. When supply catches up, as it did in 2025, prices soften. Healthy, use-driven, and deep.
- Canmore is a store of value. It can hold a small permanent population and still set price records, because buyers are not locals earning local wages. They are capital buying mountain-view assets that hold worth whether or not anyone lives in them.
What Calgary vs Canmore real estate means if you build or invest in Alberta
The volume of work will not tell you which market you are in — the buyer will. In Calgary you compete on scale, throughput and cost control, pricing demand from people who need a home. In the Bow Valley you compete on trust, feasibility and finish, pricing demand from people who want an asset. Same trade, same province, one hour apart, but one rewards scale and the other rewards scarcity. Model the wrong one and the spreadsheet lies. For any developer, contractor or investor, the first line of a feasibility study should not be a cost per square foot — it should be a single question: which map am I building off?
Frequently asked questions
Is Canmore real estate more expensive than Calgary?
Yes. At the end of 2025 Canmore’s average home price was around $1.2 million (detached near $1.8 million) versus a Calgary benchmark of $554,700 — roughly two to three times higher, depending on the property type compared.
Why did Calgary and Canmore prices move in opposite directions in 2025?
Calgary is priced by residents and local demand, which cooled as supply caught up, pushing the benchmark down 4.7%. Canmore is priced by out-of-province and intergenerational capital, which is far less sensitive to local wages and rates, so detached prices rose about 9.5%.
How many homes in Canmore are empty or second homes?
About 25.8% of Canmore homes were not occupied by a permanent resident in the 2021 Census, and the Town estimates roughly 26% are second homes in 2025 — about five times Calgary’s 5.4% rate.
What does this mean for construction and investment?
They are two different businesses. Calgary rewards volume and cost control; Canmore rewards feasibility, finish and precision on fewer, higher-value projects. The right strategy depends entirely on which market you enter.
Sources
- City of Calgary — 2024 building permits
- Town of Canmore — Building & Development Permit statistics
- CREB — December 2025 Calgary housing statistics
- Royal LePage / DiscoverAirdrie — Canmore detached prices +9.5% (2025)
- Town of Canmore — Livability Tax
- CMHC — 2025 Rental Market Report
- Statistics Canada — 2021 Census, homeownership & dwellings
Disclaimer: this article is for information only and is not financial, investment or real-estate advice. Figures are drawn from public sources as of early 2026 and may change.
- 91 views
- 0 Comment

Eros Belotti 01.

Eros belotti
Construction project manager with over 20 years of experience in Europe and the Canary Islands. Specialized in modular housing, container construction, real estate development and international project management. Founder of Reforma Vivienda Tenerife and Donkey Lab.