

//Calgary vs Edmonton construction costs: 2026 Data
Calgary vs Edmonton construction costs: 2026 Data
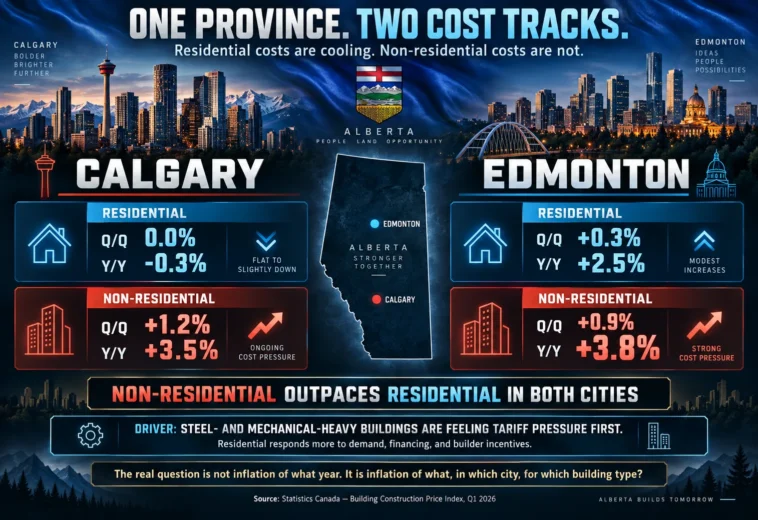
If you’re comparing Calgary vs Edmonton construction costs in 2026, the headline number depends entirely on which type of building you’re asking about. According to Statistics Canada’s Building Construction Price Index for the first quarter of 2026, residential and non-residential construction costs in Alberta’s two largest cities are moving in opposite directions — sometimes by more than three percentage points in the same three months.
For anyone budgeting, developing, or running a feasibility study in Alberta, that gap isn’t a footnote. It’s the difference between a project that pencils out and one that doesn’t.
The Q1 2026 numbers, city by city
Statistics Canada tracks construction cost inflation separately for residential and non-residential buildings in each major Canadian market. Here’s what the most recent release shows for Calgary and Edmonton:
Calgary
- Residential: 0.0% quarter-over-quarter, -0.3% year-over-year
- Non-residential: +1.2% quarter-over-quarter, +3.5% year-over-year
Edmonton
- Residential: +0.3% quarter-over-quarter, +2.5% year-over-year
- Non-residential: +0.9% quarter-over-quarter, +3.8% year-over-year
Two things stand out. First, non-residential costs are outpacing residential costs in both cities, not just one — this is a market-wide pattern, not a local anomaly. Second, the gap is wider in Calgary (3.8 percentage points between residential and non-residential) than in Edmonton (1.3 percentage points), which means a single “Alberta inflation rate” flattens out a real structural difference between the two markets.
Why non-residential costs are rising faster
The driver isn’t buyer demand — it’s what the building is made of. Statistics Canada attributes much of the non-residential increase to retaliatory tariffs on steel and steel-related products. Industrial, commercial, and institutional buildings are structurally steel- and mechanical-heavy: structural framing, rebar, curtain walls, HVAC systems, and electrical infrastructure all carry significant steel content. When input costs on steel move, non-residential construction absorbs the impact first and most directly.
This is a supply-side, input-cost story. It has little to do with how much commercial or industrial space Alberta businesses want to build right now, and everything to do with what that space costs to physically construct.
Why residential costs are cooling
Residential construction in Alberta — particularly single-family and low-rise product — remains largely wood-frame and labour-intensive. That construction method is far less exposed to steel tariffs and far more exposed to demand-side factors: financing costs, buyer affordability, and builder incentives used to move inventory. That’s a plausible explanation for why Calgary’s residential index actually declined year-over-year while Edmonton’s residential costs rose only modestly compared to its non-residential segment.
In short: two building types, two different cost structures, two different sets of pressures — happening in the same cities, in the same quarter.
Calgary vs Edmonton construction costs: the practical comparison
| Metric | Calgary | Edmonton |
|---|---|---|
| Residential YoY | -0.3% | +2.5% |
| Non-residential YoY | +3.5% | +3.8% |
| Residential vs non-residential spread | 3.8 points | 1.3 points |
Edmonton shows more consistency between building types, which may make it marginally easier to budget with a single blended assumption — though “marginally easier” still isn’t the same as accurate. Calgary shows the sharpest divergence of the two, which means a project mixing building types in Calgary carries the highest risk of a mispriced budget if only one inflation figure is applied across the board.
What this means for feasibility studies and project budgets
Most feasibility budgets in Alberta still use one blended “construction cost inflation” figure for an entire project. That approach breaks down as soon as a project mixes building types — a mixed-use development with residential units over ground-floor commercial space, for example, or an industrial park with an attached office component.
Applying one number to both components means one side of the budget is being priced against the wrong trend from day one. In Calgary specifically, where the spread between residential and non-residential inflation is nearly 4 points, that error compounds quickly on a multi-million-dollar project.
How to build a more accurate cost baseline
For anyone running feasibility studies, pre-construction estimates, or CAD-based cost modelling in Alberta, three adjustments reduce this risk:
- Split the assumption by building type, not just by project. Apply the residential index to residential components and the non-residential index to non-residential components, even within the same mixed-use project.
- Split by city, not by province. Calgary and Edmonton are diverging enough quarter to quarter that a provincial average obscures more than it reveals.
- Re-check quarterly, not annually. Because the non-residential/residential gap has held for several consecutive quarters, it’s a trend to plan around — not a one-off blip to smooth over in an annual estimate.
FAQ
Are construction costs higher in Calgary or Edmonton in 2026?
It depends on building type. Calgary’s non-residential costs are rising faster (+3.5% year-over-year) while its residential costs are actually falling (-0.3%). Edmonton shows more balanced growth across both segments (+2.5% residential, +3.8% non-residential).
Why are non-residential construction costs rising faster than residential in Alberta?
Statistics Canada attributes the increase largely to retaliatory tariffs on steel and steel-related products, which affect non-residential buildings more directly because they use more structural steel and mechanical/electrical systems than typical wood-frame residential construction.
Where does this construction cost data come from?
Statistics Canada’s Building Construction Price Index (BCPI), released quarterly, tracks residential and non-residential construction costs separately for major Canadian metropolitan areas, including Calgary and Edmonton.
How often should a construction budget be updated with this data?
Given that the gap between residential and non-residential inflation has persisted for multiple quarters, project budgets in Alberta should be reviewed against updated BCPI data at least quarterly, particularly for mixed-use or multi-building-type projects.
The bottom line
Calgary vs Edmonton construction costs isn’t a single-number comparison in 2026 — it’s at least four numbers, and they’re moving in different directions for different reasons. Projects that mix building types, or that span both cities, carry real budget risk if that nuance gets flattened into one blended inflation rate.
Eros Belotti is a construction project manager and business developer specializing in pre-construction, CAD, and feasibility studies for the Alberta market. Get in touch to discuss how these cost trends apply to your next project.
Source: Statistics Canada, Building Construction Price Indexes, Q1 2026
- 93 views
- 1 Comment

Eros Belotti 01.

Eros belotti
Construction project manager with over 20 years of experience in Europe and the Canary Islands. Specialized in modular housing, container construction, real estate development and international project management. Founder of Reforma Vivienda Tenerife and Donkey Lab.
September 23, 2026 /
Source: Statistics Canada, Building Construction Price Indexes, Q1 2026 — released April 28, 2026. Full release: https://www150.statcan.gc.ca/n1/daily-quotidien/260428/dq260428b-eng.htm
One more data point that didn’t fit above: StatCan also flags this as part of a broader pattern, not a one-off — non-residential has been the faster-moving category in both cities for several quarters running. Worth tracking quarterly if you’re pricing anything mixed-use.