

//Calgary Housing Market October 2026: Balanced on Average, Split by Type and District
Calgary Housing Market October 2026: Balanced on Average, Split by Type and District
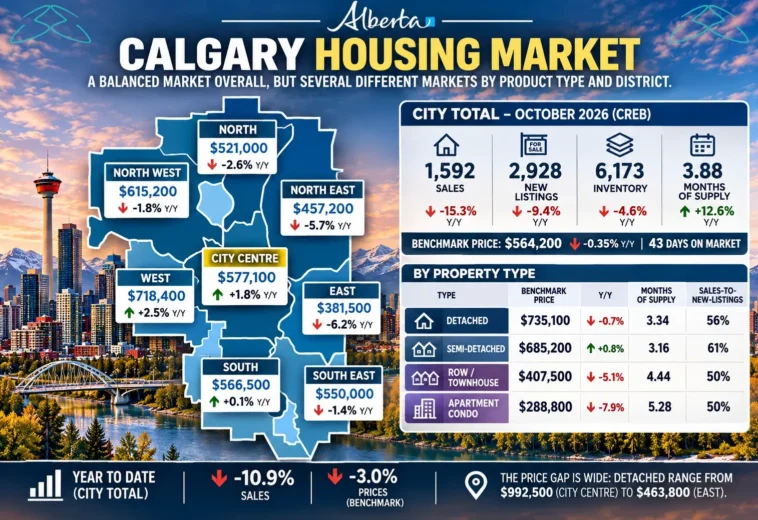
Tags : Alberta Real EstateBenchmark PriceCalgaryCalgary housing marketCondo MarketCREBFeasibilityHousing MarketMonths of SupplyYYC
Is the Calgary housing market crashing? It depends on what you own, and where.
The headline number looks calm. In October 2026, Calgary had 3.88 months of supply, according to CREB’s October 2026 statistics. In plain words: at the current pace of sales, it would take about four months to sell every home on the market. That is a balanced market, with neither buyers nor sellers in control.
But that figure is an average of very different homes in very different districts. For buyers, sellers, developers and lenders, the average hides most of what matters.
Table of Contents
- Calgary Housing Market: The City Total for October 2026
- Prices by Property Type
- Months of Supply: Where Homes Sell Slowly
- The District Split
- Two Homes, Same City, Same Month
- What It Means for Developers and Lenders
1. Calgary Housing Market: The City Total for October 2026
- Sales: 1,592, down 15.3% year over year
- New listings: 2,928, down 9.4%
- Inventory: 6,173, down 4.6%
- Months of supply: 3.88, up 12.6%
- Benchmark price: $564,200, down 0.35%
- Days on market: 43
Year to date, city-wide sales are down 10.9% and the benchmark price is down 3.0%.
Sales fell faster than new listings, so supply rose relative to demand. But inventory is still lower than a year ago. This is a market that has cooled, not one that is flooded with unsold homes.
2. Prices by Property Type
What a typical home costs now, and how much it changed in a year:
- Detached house: $735,100, down 0.7%. Barely moved.
- Semi-detached: $685,200, up 0.8%. Holding.
- Row / townhouse: $407,500, down 5.1%.
- Apartment condo: $288,800, down 7.9%.
Ground-oriented homes are stable. Higher-density product is where prices are adjusting. This matches what I discussed in Calgary’s Housing Supply Gap: growth in the region has been absorbed unevenly, and a large pipeline of apartments and townhouses has been completed in recent years.
3. Months of Supply: Where Homes Sell Slowly
The weaker the prices, the longer homes take to sell:
- Detached: 3.34 months of supply, sales-to-new-listings ratio 56%
- Semi-detached: 3.16 months, 61%
- Row / townhouse: 4.44 months, 50%
- Apartment condo: 5.28 months, 50%
As a rule of thumb, below about 3 months favours sellers, between 3 and 5 is broadly balanced, and above 5 or 6 favours buyers. Semi-detached and detached homes sit at the tighter end of balanced. Apartments are already moving into buyer territory.
4. The District Split
Location adds a second layer. Benchmark prices by district, all property types combined:
- West: $718,400, up 2.5%
- North West: $615,200, down 1.8%
- City Centre: $577,100, up 1.8%
- South: $566,500, up 0.1%
- South East: $550,000, down 1.4%
- North: $521,000, down 2.6%
- North East: $457,200, down 5.7%
- East: $381,500, down 6.2%
Looking inside the districts:
- Strongest: City Centre and West, where detached prices are up about 3%.
- Weakest: North East and East, where detached prices are down about 7% and apartments 12% to 13%.
- Biggest backlog: apartments in the North (9.5 months of supply) and the North East (8.6).
The price gap is wide: benchmark detached prices range from $992,500 in the City Centre to $463,800 in the East.
5. Two Homes, Same City, Same Month
- A detached home in the West: price up 3.2%, 2.5 months of supply. A seller’s market.
- An apartment in the North: price down 7.8%, 9.5 months of supply. A buyer’s market.
Both are “the Calgary housing market”. They behave in opposite ways.
6. What It Means for Developers and Lenders
Buyers have the upper hand in some segments, sellers in others. For developers and lenders, the city average is not enough to decide on a project. Property type and district decide how fast it sells, and at what price.
Practical implications for a feasibility study:
- Use segment data. Base absorption and pricing on the specific product type and district, not the city benchmark.
- Stress-test absorption. An apartment project in a district with 8 to 10 months of supply needs a longer sales period, and a larger interest reserve, than the city average suggests.
- Watch financing costs. Slower absorption combined with the October 2026 Bank of Canada rate hike increases carrying costs on unsold units.
- Check buyer quality. Household stress varies by city and segment, as shown in Calgary vs Edmonton Insolvencies.
- Revisit product mix. Where apartments are oversupplied, ground-oriented or rental product may fit demand better, subject to zoning and holding costs such as those discussed in Calgary’s non-residential tax ratio.
Not a Crash, Several Markets
The Calgary housing market in October 2026 is balanced overall, with a benchmark price almost unchanged from a year ago. Underneath, detached and semi-detached homes in the West and City Centre are holding or rising, while apartments and townhouses in the North, North East and East are adjusting.
The right question is not “is Calgary going up or down?” It is “which product, in which district?”
How are you reading the next 12 months for Calgary, by property type and by area?
Source: CREB, October 2026 monthly statistics (published November 2, 2026).
- 116 views
- 1 Comment

Eros Belotti 01.

Eros belotti
Construction project manager with over 20 years of experience in Europe and the Canary Islands. Specialized in modular housing, container construction, real estate development and international project management. Founder of Reforma Vivienda Tenerife and Donkey Lab.


November 5, 2026 /
The full district data behind the post (CREB, October 2026).
Benchmark price change vs October 2025 (Detached / Semi / Row / Apartment):
City Centre: +3.3% / +1.6% / -7.5% / -8.0%
North East: -6.6% / -5.4% / -8.9% / -11.8%
North: -3.5% / -2.0% / -6.3% / -7.8%
North West: -2.5% / +0.8% / -3.4% / -8.9%
West: +3.2% / -0.2% / -3.4% / -4.9%
South: -0.6% / -2.2% / -4.1% / -9.2%
South East: -1.2% / -0.9% / -5.6% / -8.2%
East: -6.8% / -7.6% / -11.5% / -13.1%
Source: https://www.creb.com/News/CREBNow/2026/November/October_2026_Stats/