
Calgary vs Edmonton Insolvencies: Same Quarter, Opposite Direction
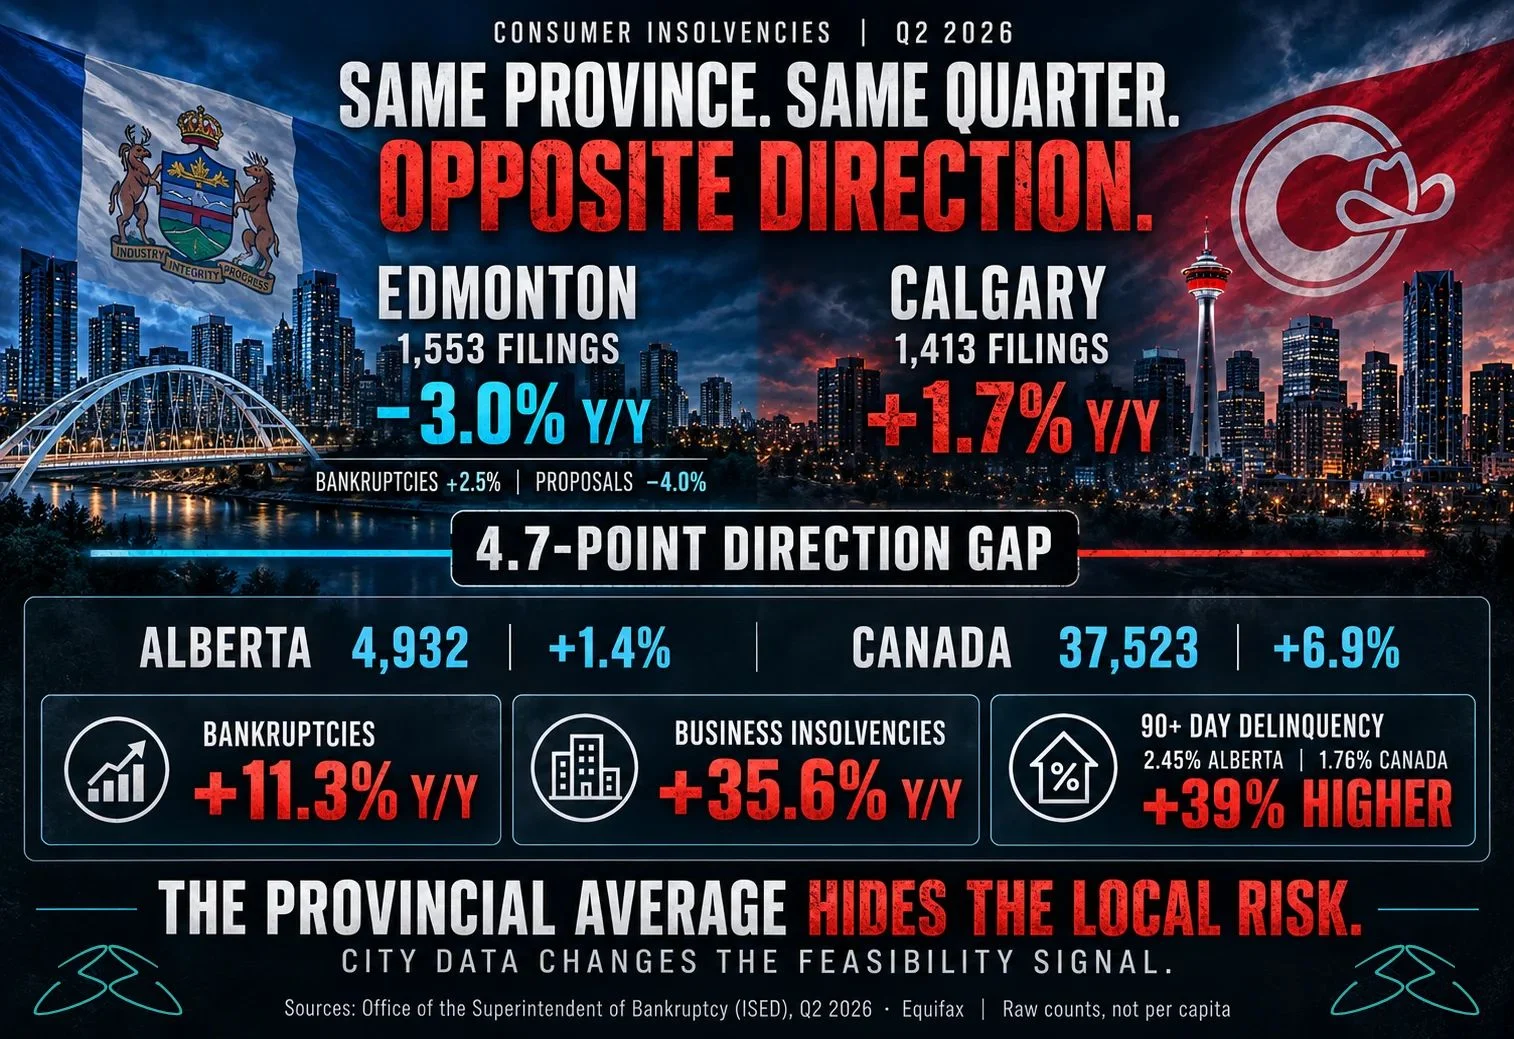
Calgary vs Edmonton insolvencies moved in opposite directions in Q2 2026. Edmonton recorded 1,553 consumer insolvency filings, down 3.0% year over year. Calgary recorded 1,413, up 1.7%.
Same province. Same quarter. A 4.7-point gap in direction.
When we talk about “the Alberta market”, we hide exactly this kind of difference. The data from the Office of the Superintendent of Bankruptcy (OSB) shows why city-level indicators matter for anyone who builds, develops or sells in the province.
Table of Contents
- Calgary vs Edmonton Insolvencies: City by City
- Alberta vs the Rest of Canada
- Inside the Alberta Number: The Mix Is Changing
- Credit and Business Signals
- Why It Matters for Development and Construction
- Three Checks Before a Feasibility Sign-Off
1. Calgary vs Edmonton Insolvencies: City by City
- Edmonton: 1,553 filings, -3.0% year over year. Bankruptcies +2.5%, consumer proposals -4.0%.
- Calgary: 1,413 filings, +1.7% year over year.
- Together: about 60% of the 4,932 consumer filings in Alberta.
Edmonton still has more filings in absolute terms, but its trend is improving. Calgary has fewer filings, but its trend is moving up. These are raw counts, not per-capita rates, so the direction is more informative than the level.
2. Alberta vs the Rest of Canada
At the provincial level, Alberta looks relatively stable:
- Alberta: 4,932 filings, +1.4% year over year.
- Canada: 37,523 filings, +6.9%. Ontario +10.2%, British Columbia +10.9%.
- Alberta 12-month total (to June 2026): 19,018, down 0.7%.
National filings reached their highest quarterly volume in years, as reported by MPA Magazine. Compared with Ontario and B.C., Alberta’s headline number looks almost flat.
3. Inside the Alberta Number: The Mix Is Changing
The flat total hides a shift in the type of filing:
- Bankruptcies: 800, +11.3% year over year and +7.8% versus Q1.
- Consumer proposals: 4,132, -0.3%. They are 83.8% of consumer filings.
Same total, different mix: fewer people restructuring, more people filing for bankruptcy.
A consumer proposal means a debtor negotiates to repay part of what is owed and usually keeps assets. A bankruptcy is a more severe outcome. A rising share of bankruptcies within a stable total suggests that, for some households, financial stress has moved beyond what restructuring can solve.
4. Credit and Business Signals
Two other indicators complete the picture:
- 90+ day non-mortgage delinquency: 2.45% in Alberta versus 1.76% for Canada, about 39% higher, according to Equifax Canada data for Q2 2026.
- Business insolvencies in Alberta: 99, +35.6%. Nationally: +0.2%.
I looked at the business insolvency trend earlier in Alberta Business Insolvencies Rose 35.6% and its implications for contractors in Alberta Construction Cash Flow: What Q2 2026 Insolvency Data Shows.
5. Why It Matters for Development and Construction
Household financial stress does not show up first in construction data. It shows up later in:
- Buyer financing: more mortgage applications declined or downsized.
- Deposits: pre-sale deposits that are harder to collect or more likely to be lost.
- Absorption: slower sales or lease-up in segments that depend on stretched households.
- Counterparties: small subcontractors and suppliers with thin balance sheets.
And it moves city by city. A provincial average would have told you Alberta is “stable”. The city data says Edmonton is improving while Calgary is drifting up.
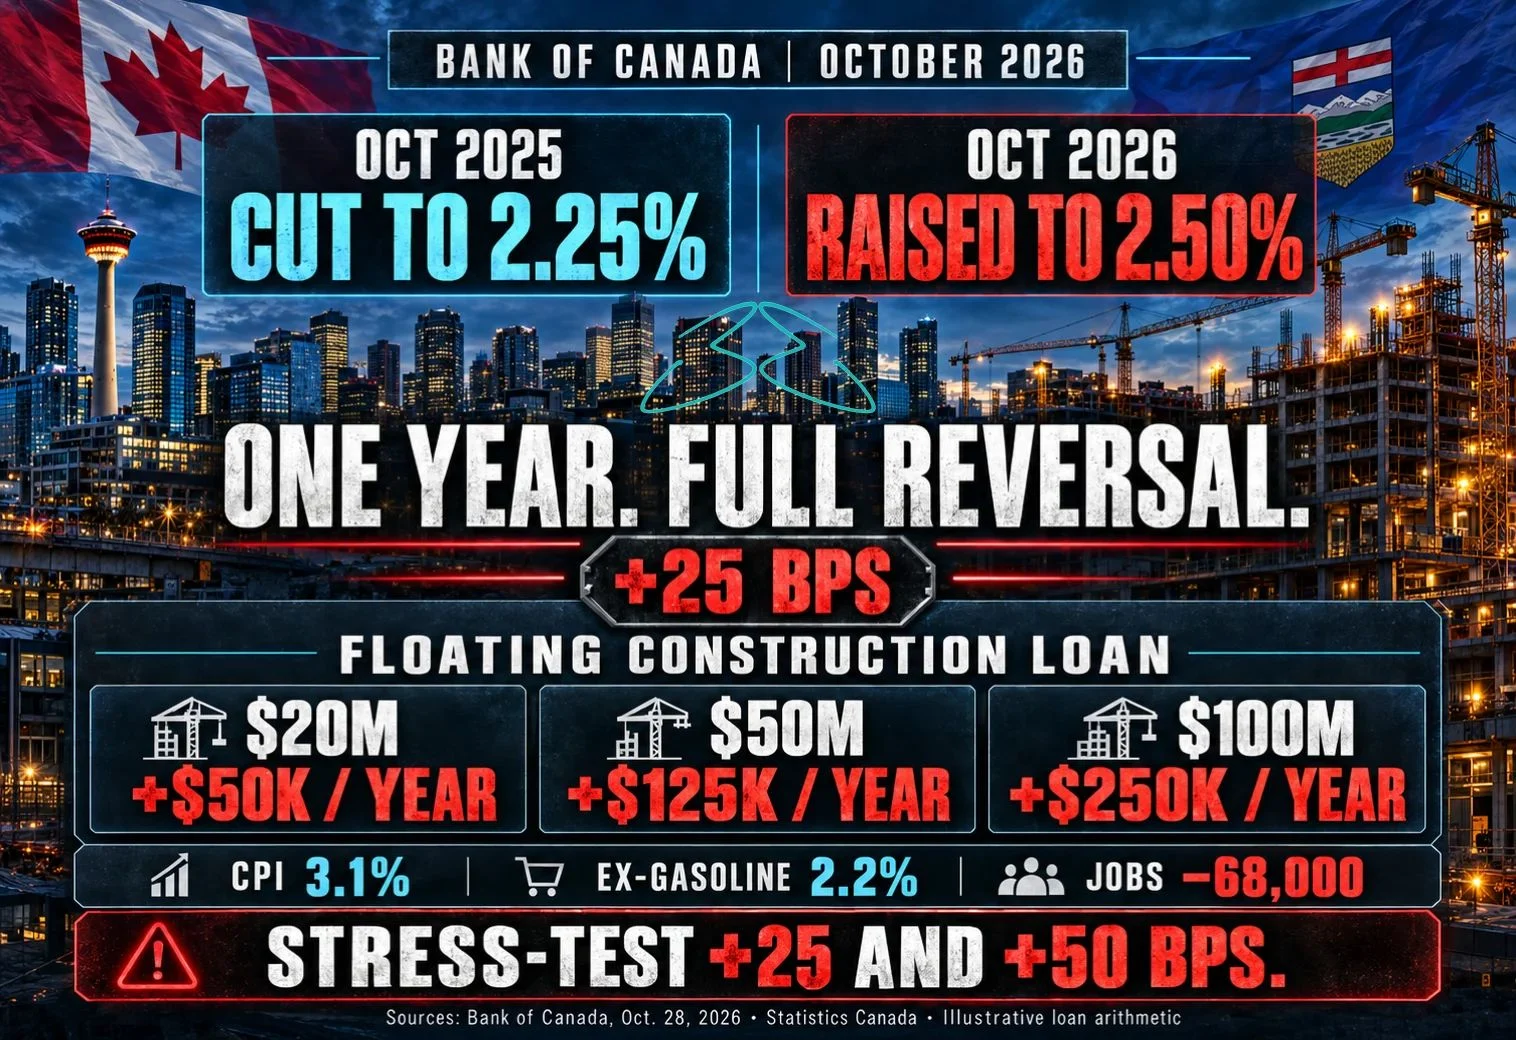
Combined with higher borrowing costs after the October 2026 Bank of Canada rate hike, this is the kind of signal that should feed directly into absorption and risk assumptions.
6. Three Checks Before a Feasibility Sign-Off
- Use city-level data, not the Alberta headline. Market risk is local.
- Read the mix, not just the total. Bankruptcies rising while proposals are flat is a different signal from a simple rise in filings.
- Check counterparty exposure: who is buying, who is paying, and what happens to your schedule and cash flow if they cannot.
Limits of the Data
These are mainly consumer filings, not construction data. Counts are raw, not per capita. It is one quarter. The business insolvency figure is not split by sector. It is an indicator, not a forecast.
Used with those limits in mind, it is still a useful early signal of where household stress is building, and where it is easing.
Which local indicators do you track besides prices and starts when you decide where to build?
Sources: Office of the Superintendent of Bankruptcy (ISED), insolvency statistics Q2 2026; Equifax Canada, Q2 2026. Raw counts, not per capita.
- 5 views
- 0 Comment

Eros Belotti 01.

Eros belotti
Construction project manager with over 20 years of experience in Europe and the Canary Islands. Specialized in modular housing, container construction, real estate development and international project management. Founder of Reforma Vivienda Tenerife and Donkey Lab.