

//Alberta Housing Starts Fell 21% in 2026. Here’s Why That’s Not the Whole Story
Alberta Housing Starts Fell 21% in 2026. Here’s Why That’s Not the Whole Story
Tags : AlbertaCalgaryCMHCconstruction marketEdmontonFeasibilityHousing StartsProject ManagementReal Estate Development
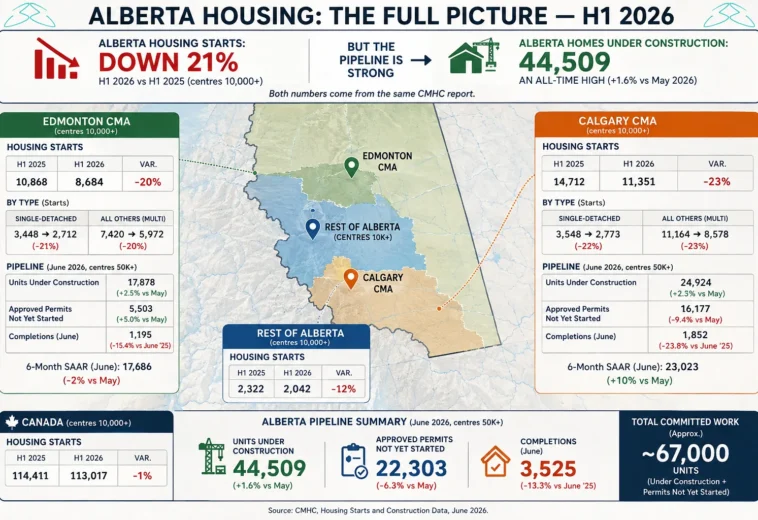
The Alberta housing starts 2026 data tells two opposite stories at once. Starts fell 21% in the first half of the year — the sharpest drop of any province in Canada. At the same time, the province has 44,509 homes under construction, an all-time high. Both figures come from the same CMHC report. Here is what that contradiction actually means for anyone building in Alberta.
Alberta housing starts 2026: the headline number
According to CMHC’s June 2026 release, Alberta recorded 22,077 housing starts in centres of 10,000 population and over between January and June 2026, down from 27,902 in the same period of 2025. That is a decline of 21%.
For context, Canada as a whole recorded 113,017 starts over the same period, down just 1% from 114,411. Ontario was up 14%. Quebec was up 2%. Manitoba was up 39%.
So Alberta did not simply cool along with the rest of the country. It cooled harder than anywhere else — and it did so immediately after a record year. In 2025 Alberta posted roughly 54,900 housing starts, a 14% increase over 2024, against a national increase of 5.6%.
Read on its own, that reversal looks alarming. Read alongside the rest of the data, it looks like something quite different.
Where the decline actually landed: Calgary, Edmonton and the rest of Alberta
Provincial averages hide more than they reveal. Broken down by region, the first half of 2026 looks like this:
| Region (centres 10,000+) | H1 2025 | H1 2026 | Change |
|---|---|---|---|
| Alberta | 27,902 | 22,077 | −21% |
| Calgary CMA | 14,712 | 11,351 | −23% |
| Edmonton CMA | 10,868 | 8,684 | −20% |
| Rest of Alberta | 2,322 | 2,042 | −12% |
| Canada | 114,411 | 113,017 | −1% |
Two observations matter here.
First, the decline is broad. Calgary and Edmonton account for the overwhelming majority of Alberta’s starts, and both fell by roughly the same order of magnitude. This is not a story about one overheated submarket correcting.
Second, Alberta’s smaller centres held up noticeably better, falling 12% against 23% in Calgary. On a small base — roughly 2,000 units — that difference is easy to overstate. But for contractors and developers with the flexibility to work outside the two major CMAs, it is worth noting.
The decline is not a shift in product mix
One reasonable hypothesis would be that the drop reflects a rotation away from one dwelling type. The data does not support it.
| Region | Single-detached | All others (multi-unit) |
|---|---|---|
| Alberta | 7,792 → 6,275 (−19%) | 20,110 → 15,802 (−21%) |
| Calgary | 3,548 → 2,773 (−22%) | 11,164 → 8,578 (−23%) |
| Edmonton | 3,448 → 2,712 (−21%) | 7,420 → 5,972 (−20%) |
Singles and multiples fell at nearly identical rates in every market. Whatever is slowing new project launches in Alberta is affecting the whole residential sector, not redistributing activity within it.
The number almost nobody quotes: 44,509 units under construction
Here is where the picture changes.
As of June 2026, Alberta had 44,509 dwelling units under construction in centres of 50,000 and over — up 1.6% from May. A further 22,303 units held approved building permits but had not yet broken ground.
Combined, that is roughly 67,000 units of committed work in the province.
| Indicator (June 2026) | Alberta | Calgary | Edmonton |
|---|---|---|---|
| Units under construction | 44,509 (+1.6% MoM) | 24,924 (+2.3%) | 17,878 (+2.5%) |
| Approved permits, not yet started | 22,303 (−6.3%) | 16,177 (−9.4%) | 5,503 (+5.0%) |
| Completions (month of June) | 3,525 (−13.3%) | 1,852 (−23.8%) | 1,195 (−15.4%) |
Note the direction of travel. Starts are down sharply. Units under construction are up month over month in both major markets. Completions are down, meaning units are staying on site longer rather than clearing the pipeline.
There is one further signal worth watching. Edmonton is the only market in Alberta where approved-but-not-yet-started units rose in June, up 5.0%, while Calgary fell 9.4% and the province fell 6.3%. That is a single month of data and should not be read as a trend. But at present it is the only leading indicator in Alberta pointing upward.
Why housing starts is the wrong number to plan against
Housing starts are the most widely quoted construction statistic in Canada. They are also the most widely misused.
The three headline CMHC indicators measure three different points in the project lifecycle:
- Housing starts are a leading indicator. They tell you what developers decided 6 to 18 months ago, and therefore what the market believes about next year.
- Units under construction are a coincident indicator. They tell you how much work is physically on site right now — your actual addressable market this year.
- Completions are a lagging indicator. They tell you what was decided two or three years ago and is now clearing.
Confusing the first for the second is an expensive mistake. A general contractor who reads the Alberta housing starts 2026 figure and reduces crew capacity accordingly will be short-staffed against a record volume of active sites. A supplier who does the same will under-order. A developer who reads it as a demand signal may abandon a site that will be viable precisely when the current pipeline clears.
The correct reading is narrower and more useful: fewer new projects are being launched in Alberta, while more work than ever is already underway. Those are separate facts with separate implications.
What is driving the slowdown in new starts
CMHC attributes the national slowdown to rising uncertainty, higher development costs, softer demand and elevated unsold inventory. In Alberta, three structural factors compound the picture.
Population growth has not stopped
Alberta’s population passed five million on 1 July 2025, and the province has led Canada in net interprovincial migration for twelve consecutive quarters. Underlying housing demand has not disappeared — the constraint is on the supply side, not the demand side.
Labour is the binding constraint
BuildForce Canada projects that Alberta’s construction industry must recruit approximately 59,000 workers between 2025 and 2034, largely to replace 43,400 expected retirements — 21% of the 2024 workforce. Even accounting for new entrants, the province faces a projected shortfall of 15,400 workers. Non-residential construction employment is forecast to rise 15% by 2035, with ICI building construction up 31%.
In other words: Alberta will be competing for the same trades across residential, institutional and industrial work simultaneously. Capacity, not demand, will determine what gets built.
Public funding is entering the enabling-infrastructure layer
On 29 July 2026, Canada and Alberta signed an infrastructure agreement giving Alberta municipalities access to $510 million over eight years through the Canada Housing Infrastructure Fund, targeted at housing-enabling water and wastewater projects. Separately, Build Canada Homes — the federal agency launched in September 2025 with $13 billion in initial funding — includes Edmonton among six pilot sites for 4,000 factory-built homes. Alberta’s own target is 25,000 additional affordable homes by 2031.
When public money funds servicing, land parcels that previously failed a feasibility test can start to work. That is a slow-moving effect — but it is one reason Edmonton’s forward permit pipeline may be behaving differently from Calgary’s.
What this means for developers and contractors in Alberta
The practical conclusion is that the Alberta opportunity in 2026 has changed shape rather than disappeared. It has moved from winning new starts to delivering committed work. Three implications follow.
1. Plan capacity against units under construction, not starts
With 44,509 units on site and completions falling, site duration is lengthening. Resourcing decisions taken from the starts figure alone will be wrong by roughly a year.
2. Margin now comes from execution, not volume
In a market where new launches are contracting, protecting margin on existing projects matters more than winning the next one. The numbers here are unforgiving. Construction Industry Institute data puts direct field rework at roughly 5% of total construction value on average, rising to 12.4% at the 90th percentile; adding design rework brings the total to 6–15% of project value. Roughly nine in ten construction projects run over budget, by an average of 28%. Around 32% of overruns trace back to estimating error, and 26% of rework to miscommunication.
Put differently: on a delivery-heavy pipeline, accurate survey data, clean CAD documentation and disciplined project controls are not overhead. They are the cheapest margin protection available.
3. Re-run feasibility on parcels you shelved
Between the $510 million infrastructure agreement, Build Canada Homes and continued population growth, the inputs to a 2024 or 2025 feasibility study have changed materially. Sites that failed on servicing cost may now clear. Sites that cleared on absorption assumptions may not.
Alberta housing starts 2026: the bottom line
Alberta housing starts fell 21% in the first half of 2026 against a national decline of 1%. That is a real signal and should not be dismissed: fewer new residential projects are being launched, in both Calgary and Edmonton, across both single-detached and multi-unit product.
But 44,509 units are under construction and another 22,303 hold approved permits. Roughly 67,000 units of work are already committed. The market has not stopped — it has moved from the launch phase to the delivery phase.
Different market. Different skill set.
Frequently asked questions
How many housing starts did Alberta record in the first half of 2026?
The Alberta housing starts 2026 total for the first half of the year was 22,077 units in centres of 10,000 population and over, down 21% from 27,902 in the same period of 2025, according to CMHC.
Why did Alberta housing starts fall in 2026?
CMHC cites rising uncertainty, higher development costs, weaker demand and elevated unsold inventory. In Alberta the decline follows a record 2025 of roughly 54,900 starts, and is compounded by a construction labour shortage projected at 15,400 workers by 2034.
Is the Alberta construction market slowing down?
New project launches are slowing, but active construction is not. As of June 2026 Alberta had 44,509 units under construction — up 1.6% month over month — plus 22,303 units with approved permits awaiting start. The market has shifted from launching projects to delivering them.
How did Calgary and Edmonton housing starts compare in 2026?
Calgary recorded 11,351 starts in the first half of 2026, down 23%. Edmonton recorded 8,684, down 20%. Alberta’s smaller centres fell 12%, the mildest decline in the province.
Sources
- CMHC — Housing starts and construction data for June 2026
- CMHC — Housing starts up 5.6% in 2025 from 2024
- BuildForce Canada — Employment demands increase in Alberta to 2034
- Prime Minister of Canada — Canada and Alberta forge new infrastructure partnership
- Statistics Canada / CBC — Alberta leads country in interprovincial migration
- 381 views
- 1 Comment

Eros Belotti 01.

Eros belotti
Construction project manager with over 20 years of experience in Europe and the Canary Islands. Specialized in modular housing, container construction, real estate development and international project management. Founder of Reforma Vivienda Tenerife and Donkey Lab.

August 7, 2026 /
Full regional breakdown on the blog — Calgary, Edmonton and the rest
of Alberta, the single vs multi-unit split, and what the $510M
Canada–Alberta infrastructure agreement changes for feasibility:
https://www.erosbelotti.com/
Primary sources, so you can check the numbers yourself:
CMHC — Housing starts and construction data, June 2026 (H1 figures,
units under construction, permits awaiting start):
https://www.cmhc-schl.gc.ca/media-newsroom/news-releases/2026/housing-starts-june-2026
CMHC — Housing starts up 5.6% in 2025, the record year this is
measured against:
https://www.cmhc-schl.gc.ca/media-newsroom/news-releases/2026/housing-starts-december-2025
BuildForce Canada — Alberta labour demand to 2034:
https://www.buildforce.ca/en/press-release/employment-demands-increase-in-alberta-to-2034-with-growth-greatest-in-the-non-residential-sector/
Government of Canada — Canada–Alberta infrastructure agreement,
29 July 2026:
https://www.pm.gc.ca/en/news/news-releases/2026/07/29/canada-and-alberta-forge-new-infrastructure-partnership-accelerate
Methodology note: starts cover centres of 10,000+, while
under-construction and permit figures cover 50,000+. Not directly
comparable as totals — the direction of travel is what matters