
Building Permits Up 9.8%, Construction GDP Down 0.6%: Reading Canada’s Q4 2025 Data
At the end of 2025, two Canadian construction indicators moved in opposite directions. Building permit values jumped 9.8% in the fourth quarter, the strongest quarterly gain since 2021. In the same quarter, real construction GDP fell 0.6%, its first decline after six consecutive quarters of growth. Many headlines read the permit number as a boom signal. Read together, the two numbers tell a more useful story about margins, costs and risk.
This article explains what each indicator measures, why they diverged, and what developers and contractors in Alberta should take from the data when planning projects in 2026.
The numbers
According to the Canadian Construction Association’s Spring 2026 Economic Report:
- Building permits rose 9.8% in Q4 2025 to $35.7 billion, although full-year 2025 permit values were still 2.5% below 2024.
- Real construction GDP fell 0.6% quarter over quarter in Q4 2025, ending six straight quarterly gains, while annual growth for 2025 remained positive at 2.3%.
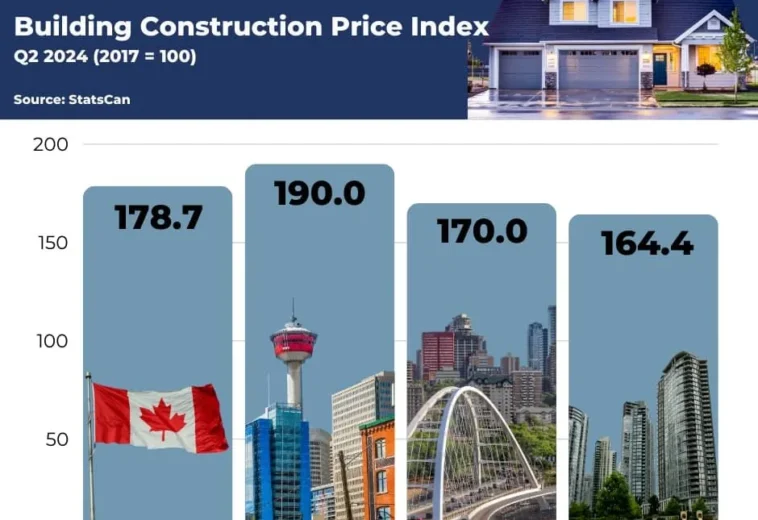
- The Building Construction Price Index was up 4.1% year over year in Q4 2025, with factory construction up 6.2% and high-rise apartments up 2.2%.
- Investment in building construction reached $63.9 billion in Q4, up 5.9% year over year nationally.
Alberta showed its own contrast: permit values rose 14% in the quarter and multi-dwelling permits rose 25.4%, while investment in building construction in the province fell 1.3% in Q4 and 4.1% over the full year.
Permits measure intent; GDP and costs measure reality
A building permit records the value of work that owners plan to do. It is a forward-looking indicator of intent, and it can jump in a single quarter when a few large projects are approved. Construction GDP measures the value of work actually performed, after adjusting for prices. Investment data measures the money actually spent.
When permits rise while real output falls, it usually means one of three things: approved projects have not started yet, projects are taking longer to deliver, or rising costs mean each dollar buys less construction. In late 2025 all three were plausible.
Why costs matter more than permits
A 4.1% annual increase in construction prices is not dramatic on its own, but it compounds. A project budgeted in 2024 and built in 2026 can face cost increases of 8% or more on items that were not locked in. Combined with softer sales prices in some residential segments, rising costs squeeze margins from both sides.
Permits do not capture this. A permit value is based on the estimate at application. If construction costs rise before or during the work, the permit total stays the same while the real budget changes.
A split market: public and private
The same data hides a sectoral split. Public and institutional work, such as infrastructure, health care and education, is supported by government capital plans and long-term funding. Private residential development depends on sales and rents, which in some Alberta segments softened in early 2026. Same province, different risk profile.
For contractors, this means diversification matters. For developers, it means market-rate residential projects need more conservative assumptions than a year ago, while publicly funded segments may offer steadier pipelines.
How to read construction indicators together
Pair permits with starts and investment
Permits show what is planned. Starts and investment show what is actually happening. A gap between them signals delays or cancellations.
Pair activity with prices
Always read output data with the construction price index. Growth in nominal spending may be mostly inflation.
Look at the segment, not the total
Factory, high-rise residential, institutional and single-family construction move differently. Choose indicators that match your project type.
Use local data
National numbers can mask provincial and city-level trends. Alberta, Ontario and British Columbia were in very different positions in 2025.
What it means for project budgets in 2026
- Escalation allowance: include realistic escalation for the period between estimate and procurement, especially for structural steel, concrete and mechanical equipment.
- Procurement timing: lock prices for long-lead items as soon as design is frozen.
- Contingency by risk: renovation, complex structures and tight schedules justify higher contingency.
- Feasibility refresh: a pro forma prepared in 2024 should be re-run with current costs, prices and absorption before committing to construction.
- Contract strategy: consider who carries escalation risk and price it explicitly rather than assuming it away.
The early 2026 picture
Early 2026 data showed construction employment rising again. The CCA reported national construction employment up about 11,300 jobs in the first two months of the year, and Alberta’s construction employment up about 4,700 jobs, the largest gain among the provinces cited. More hiring alongside higher costs is consistent with a busy but compressing market: plenty of work, thinner margins.
The provincial fiscal context also matters. The CCA notes that Alberta’s 2026-27 deficit forecast worsened because of lower oil revenue, which may influence the pace of future public capital spending.
A note for owners and investors
Owners and investors often receive market updates that highlight one positive number. When a consultant, broker or contractor presents rising permits as proof of a strong market, ask three follow-up questions: what happened to construction costs over the same period, what happened to actual starts or investment in the relevant segment, and what does the trend look like at the city level? The answers usually give a much more balanced picture. In late 2025 and early 2026, Alberta’s permit values were rising while investment in building construction in the province fell over the full year. Both facts matter, and a sound investment decision needs both.
The bottom line
Rising permits are good news for the industry, but they do not protect anyone’s margin. When permits measure intent and costs measure reality, the professionals who read both numbers at the same time make better decisions about which budget, which segment and how much contingency. Permits don’t protect your margins. Feasibility does.
If you are running numbers on a project in Alberta and want a second read, see my feasibility and project management services, read why construction budgets fail before site, or contact me.
Frequently asked questions
Did Canadian construction GDP fall in Q4 2025?
Yes. Real construction GDP fell 0.6% in the fourth quarter of 2025, the first decline after six consecutive quarterly increases, according to the Canadian Construction Association.
How much did building permits rise in Q4 2025?
Permit values rose 9.8% to $35.7 billion, the strongest quarterly gain since Q4 2021. Alberta’s permit values rose 14%.
How fast are construction costs rising in Canada?
The Building Construction Price Index was up 4.1% year over year in Q4 2025.
Sources
- Canadian Construction Association: Economic Report, Spring 2026
- Statistics Canada: Building construction price indexes, fourth quarter 2025
- 150 views
- 0 Comment

Eros Belotti 01.

Eros belotti
Construction project manager with over 20 years of experience in Europe and the Canary Islands. Specialized in modular housing, container construction, real estate development and international project management. Founder of Reforma Vivienda Tenerife and Donkey Lab.