

//Edmonton Overtakes Calgary in Interprovincial Migration: What It Means for Construction
Edmonton Overtakes Calgary in Interprovincial Migration: What It Means for Construction
Tags : CalgaryCMHCconstruction labourdata centresEdmontonhousing starts. interprovincial migrationsite selection
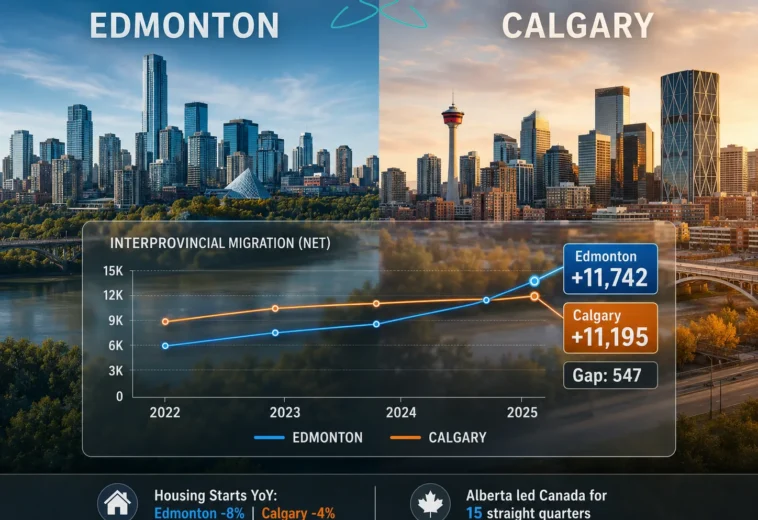
For years, Calgary was the default answer to the question of where Canadians were moving within Alberta. That changed in the most recent annual data. According to Statistics Canada figures summarised by StrategyCorp, Edmonton recorded 11,742 net interprovincial migrants between July 1, 2024 and July 1, 2025, overtaking Calgary’s 11,195 to become the leading destination in Canada for people moving from other provinces. Edmonton also posted the fastest population growth of any census metropolitan area, at 3.1%, ahead of Calgary at 2.9%.
The margin, 547 people, is small. The implication for developers, contractors and investors is not. This article explains what the data show, how supply is responding and why site selection assumptions deserve a second look.
The numbers behind the shift
- Edmonton: 11,742 net interprovincial migrants, first among Canadian CMAs; population growth of 3.1%.
- Calgary: 11,195, second; population growth of 2.9%.
- Toronto: a net interprovincial loss of 12,698, the largest deficit in the country, and an overall population decline of about 1,000.
- Lethbridge and Red Deer also gained through interprovincial migration.
Alberta as a whole has led Canada in net interprovincial migration for more than three years. Rankings tend to lag reality rather than lead it, so the flip between Edmonton and Calgary is a signal worth taking seriously.
Growth is slowing, and redistributing
One caveat deserves to be stated plainly: Alberta’s overall population growth is slowing, from 4.7% in 2024 to about 2.5% in 2025 and an expected 1.5% in 2026 according to ATB Financial. This is not acceleration. It is redistribution, and the Edmonton region is increasingly on the receiving end.
Why Edmonton is attracting movers
Affordability
RBC Economics estimated that owning a home in Edmonton required 36.8% of median household income in Q2 2026, compared with 41.3% in Calgary. Average prices are far lower: Sagen reported Edmonton’s June 2026 average at about $464,900, against about $659,400 in Calgary.
Zoning and housing choice
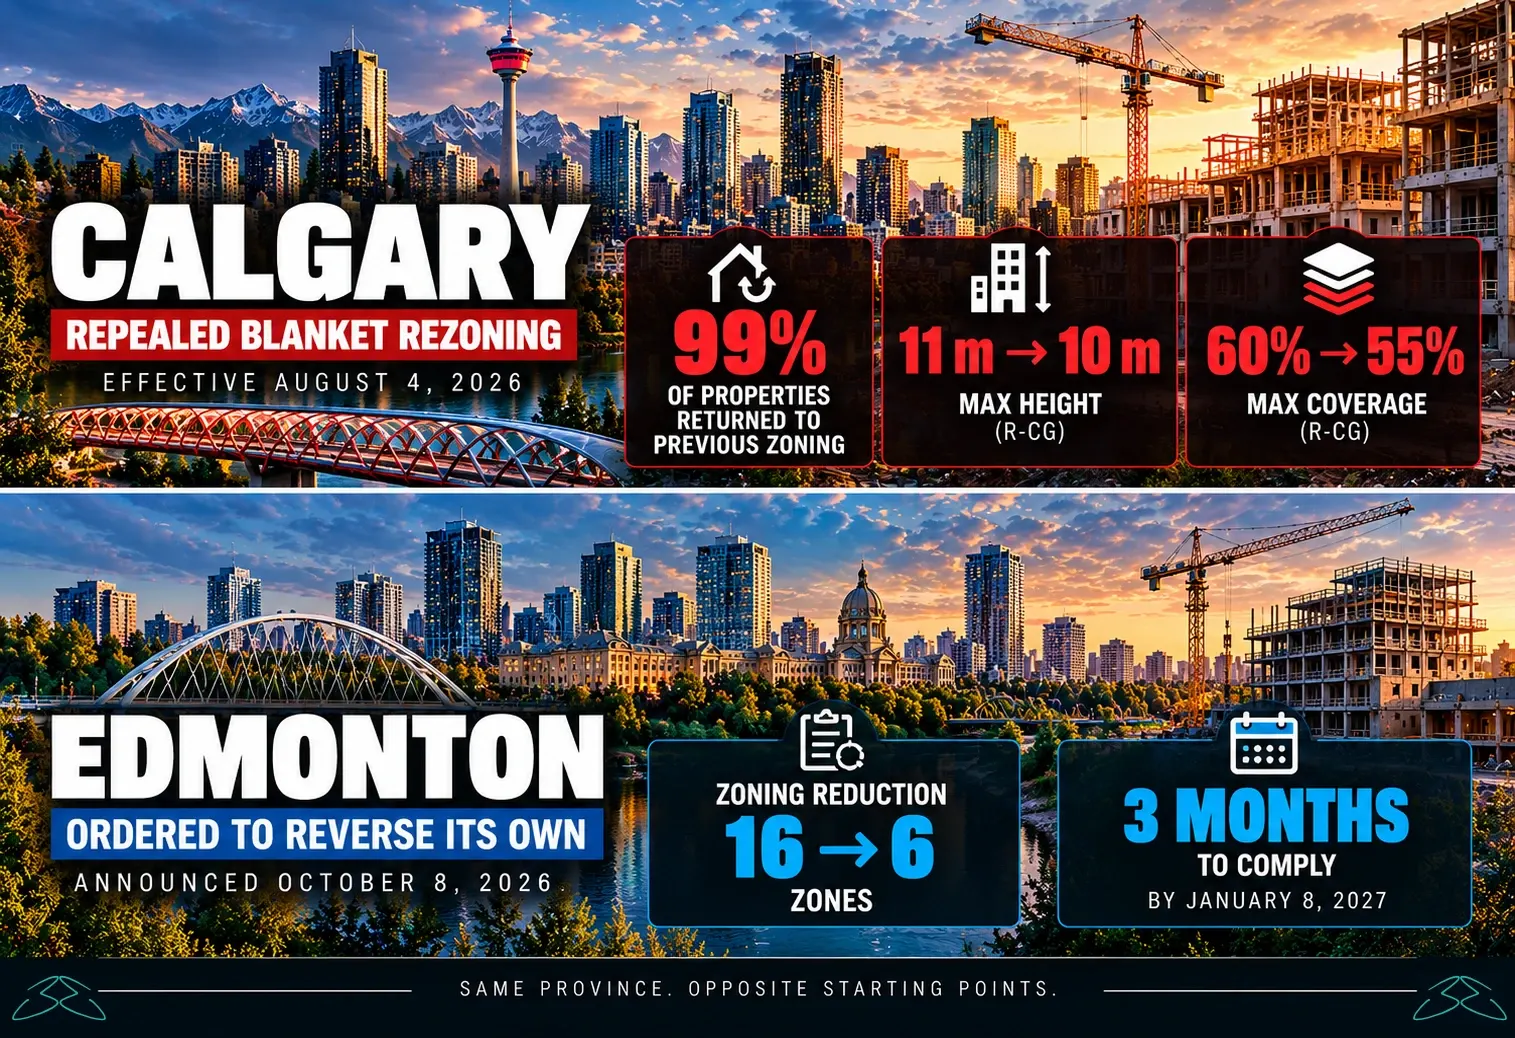
Edmonton’s 2024 zoning bylaw allows up to eight units on many residential lots, supporting more missing middle housing. Calgary repealed its citywide rezoning in 2026.
Major projects
About 30 kilometres north of the city, Meta is building a data centre in Sturgeon County with an investment of more than $13 billion and over 3,000 construction jobs at peak. Industrial, energy and public projects in the capital region add further employment.
How supply is responding
Housing starts are falling in both cities after record years. CMHC reported that by May 2026 year-to-date starts were down 14% in Edmonton and 28% in Calgary, although both six-month trends rose slightly. CMHC’s mid-year outlook expects Edmonton starts of about 16,000 in 2026, down from 21,337 in 2025, and Calgary starts of about 22,000, down from 27,684.
The result in Edmonton is more incoming demand meeting a smaller new supply response. Rental data reflect relative resilience: Edmonton rents have softened less than Calgary’s in 2026, and CMHC expects Edmonton’s vacancy to remain below Calgary’s.
What this means for project decisions
Review site selection defaults
For many European and out-of-province firms evaluating Alberta, Calgary has been the reflexive choice. The migration data suggest testing that assumption before it hardens into a decision. Edmonton offers lower entry costs and steady inflows; Calgary offers higher prices and a larger corporate base.
Absorption assumptions
Absorption models built on 2023 and 2024 conditions may understate near-term demand in parts of the Edmonton region and overstate it for some Calgary segments.
Execution capacity
Labour remains the binding constraint. BuildForce Canada projects Alberta must add 48,800 construction workers by 2035. Large projects north of Edmonton will compete with housing for trades, which affects both costs and schedules in the capital region.
Feasibility carries more weight
When labour is scarce and expensive, errors found late are disproportionately costly. Accurate surveys, coordinated design and realistic schedules matter more than in a slack market.
What to watch next
The next annual migration estimates will show whether Edmonton’s lead persists. Monthly CMHC starts and rental data will show whether supply responds. And progress on large projects such as the Meta data centre will indicate how much additional demand for workforce housing the region will face. Developers who track all three can time projects more precisely than those relying on last year’s narrative.
Risks to the migration trend
Interprovincial migration can change direction quickly, so it should be treated as a scenario variable rather than a fixed assumption. Three factors could slow Edmonton inflows. First, if prices in Edmonton keep rising faster than in Calgary, the affordability gap that attracts movers will narrow. Second, a slowdown in Ontario and British Columbia housing costs would reduce the push factor that drives households west. Third, employment matters: migration follows jobs, and a weaker energy or public sector hiring cycle would weigh on arrivals. A sound feasibility study should therefore test a project against a lower-migration case, not only the recent trend. Projects that still work when inflows moderate are the ones worth building, because they do not depend on the current wave of movers continuing indefinitely.
Monitoring the quarterly Statistics Canada estimates and the City of Edmonton population updates is the simplest way to see whether the shift is holding.
The bottom line
The headline story is a slowing province. The underlying story is a province redistributing growth internally, with Edmonton now attracting more interprovincial movers than Calgary while new supply contracts. For anyone allocating capital or construction capacity in Alberta over the next 24 months, the second story is the one that changes decisions.
If you are comparing locations in Alberta, see my feasibility services, read Calgary or Edmonton in 2026, or contact me.
Frequently asked questions
Did Edmonton overtake Calgary in interprovincial migration?
Yes. From July 2024 to July 2025, Edmonton recorded 11,742 net interprovincial migrants versus Calgary’s 11,195, ranking first in Canada.
Which Canadian city grew fastest in 2024/25?
Edmonton, at 3.1%, followed by Moncton at 3% and Calgary at 2.9%.
Are housing starts rising in Edmonton?
No. Starts are falling from record levels; CMHC reported Edmonton year-to-date starts down 14% by May 2026.
Sources
- StrategyCorp: Canada’s urban demographic shift (Statistics Canada data)
- CMHC: Housing starts, May 2026
- CMHC: Summer update, 2026 Housing Market Outlook
- Sagen: Alberta housing market update, June 2026
- Government of Alberta: AI data centres by the numbers
- 170 views
- 1 Comment

Eros Belotti 01.

Eros belotti
Construction project manager with over 20 years of experience in Europe and the Canary Islands. Specialized in modular housing, container construction, real estate development and international project management. Founder of Reforma Vivienda Tenerife and Donkey Lab.


July 20, 2026 /
Sources, for anyone who wants to check the numbers:
→ Interprovincial migration by CMA — Alberta Economic Dashboard: economicdashboard.alberta.ca/dashboard/net-migration
→ Housing starts, March 2026 — CMHC Housing Supply Report
→ Meta Sturgeon County project details — Government of Alberta announcement, July 2026
One thing I left out of the post for length: Edmonton and Calgary are now both above 1.6M. Fifteen years ago that gap was meaningful. It isn’t anymore — which is part of why the migration flip matters more than the 547-person margin suggests.